prompt topic
Codex prompts for dashboards and app shells
Answer in brief
A Codex dashboard prompt should give the agent the shell, the data and the states. Describe the frame (sidebar, top bar, content grid), supply a fixture file with the exact shape of the data, and list what each panel shows when it is loading, empty and failed. Without the data shape the agent invents one, and the layout is fitted to numbers you'll never have.
Keep the first task to the shell and one screen. Other screens are follow-up tasks that reuse the shell.
Start from the data file
Write a small JSON fixture before the brief: ten rows of the real table, a month of the real series, with realistic lengths and extremes. A long customer name, a zero, a negative, a value in the millions. Put it in the repository and name it in the brief.
The design of a data screen is mostly decided by its awkward values. A table designed around "Item 1, Item 2" breaks on the first real row.
Specify density in numbers
Dashboards are judged by how much fits and how calm it stays. That is a set of numbers: row height, cell padding, the base type size, the gap between panels, the sidebar width. Give them. Say that figures use tabular numerals and align right, and say how numbers are formatted: thousands separators, decimals, currency, dates.
Three states for every panel
Each panel that shows data has at least three more faces: loading, empty and error. Say what each looks like. A skeleton with the same row height. One line of text and one action. A message and a retry button. Ask for a way to force each state, such as a query parameter, so you can review them without breaking the network.
These states are also the easiest things for the agent to test, which gives it something concrete to run before it reports back.
What a dashboard brief for Codex should contain
- The shell: sidebar width, top bar height, content grid.
- A fixture file with the real data shape and awkward values.
- Each panel: what it shows and which fields it reads.
- Density: row height, type size, padding, gaps, number format.
- States: loading, empty and error for every data panel.
- Narrow screens: what the sidebar and the table become.
A prompt to start from
Task: build the app shell and the Overview screen for [product], a [what it tracks] tool. Data comes from src/fixtures/overview.json; read its shape and use it as is. No back end in this task.

Stack: Vite + React + TypeScript, plain CSS with custom properties in src/styles/tokens.css. Charts are hand-written SVG. No UI or chart library.

Shell: a sidebar 232px wide, ground #101216, with [five nav items]; the active item has a #1c2028 fill, radius 8px. A top bar 56px tall with the screen title on the left and a date-range button on the right. Content ground #16191f, 24px padding, panels on #1c2028 with a 1px #2a2f39 border, radius 12px, 16px gaps.

Type: "Inter". Base 13px, panel titles 12px uppercase #8b93a1, key figures 28px weight 600 with tabular numerals. Text #e7eaf0. One accent, #5ee0a0, for positive change; #ff6b5e for negative.

Overview screen, 12-column grid:
1. Four stat tiles (3 columns each): label, figure, change against the previous period.
2. A line chart (8 columns, 280px tall): one series, 1.5px line, a hover line that shows the value and date.
3. A ranked list (4 columns): top five [items] with horizontal bars.
4. A table (12 columns): [columns], rows 40px tall, numbers right-aligned, sortable by clicking a header.

States for panels 2 to 4: loading (skeleton blocks pulsing between 40% and 70% opacity over 1.2s), empty ("No [items] in this range" and a Reset range button), error (message and Retry). Force a state with ?state=loading, empty or error.

Below 900px the sidebar becomes a 56px icon rail; below 600px it becomes a bottom bar, tiles go two per row, and the table scrolls sideways inside its panel. With prefers-reduced-motion the skeletons do not pulse.

Done when npm run build and npm run typecheck pass, sorting is covered by a test, and each forced state renders. Run it, check all three states at 390px and 1440px, and report.
Written for this page as a starting point; swap the parts in [brackets] for your own. The full prompt of each uberdesigner template is longer and specific to one finished design, and it is tested by rebuilding the template from the prompt alone.
Dashboards and data screens to start from
Finished dashboards and data views on uberdesigner. Most of these are Pro and several are built around a live 3D object; budget mixer is free. Use one for its look and density, and give Codex your own fixture file.
-
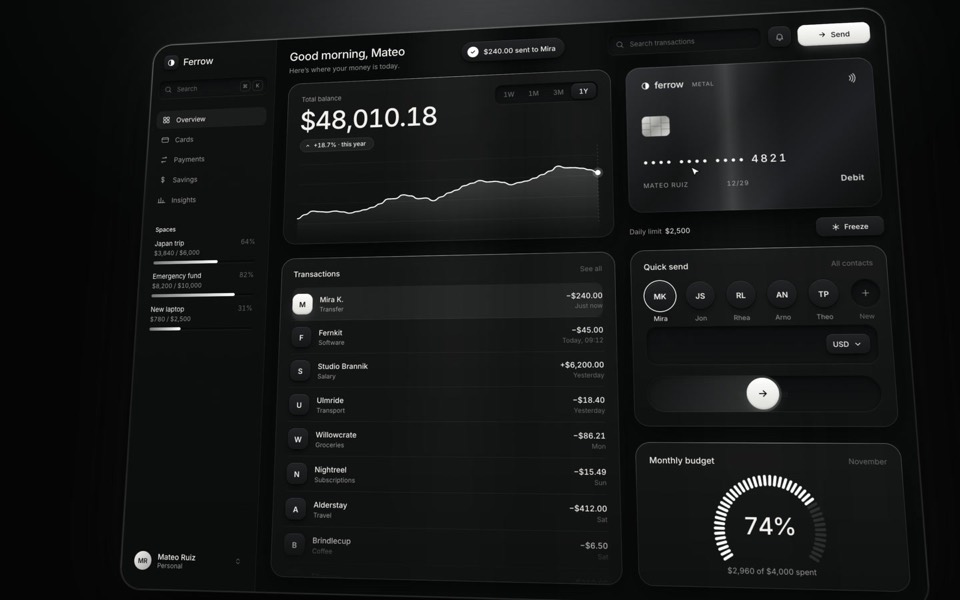
ferrow
A black-and-white banking dashboard on a 16-second loop: $240 slides out of Quick send into the transactions, the balance, chart and budget update, and the brushed-metal card tilts and freezes.
see it on uberdesigner -
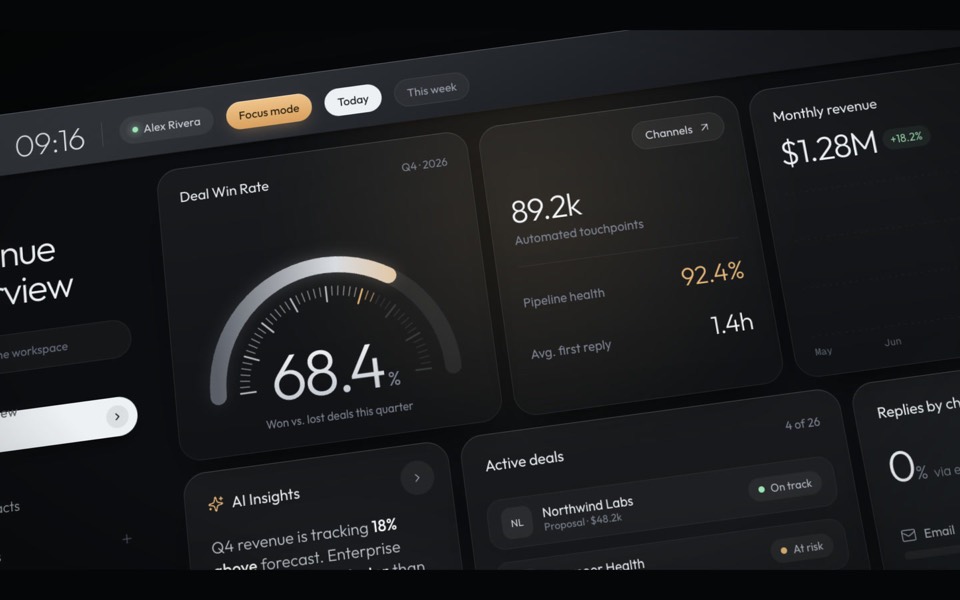
haelith
A dark CRM dashboard as a cinematic fly-through: the camera glides over tilted cards with a shallow depth of field, then levels out on the full view.
see it on uberdesigner -
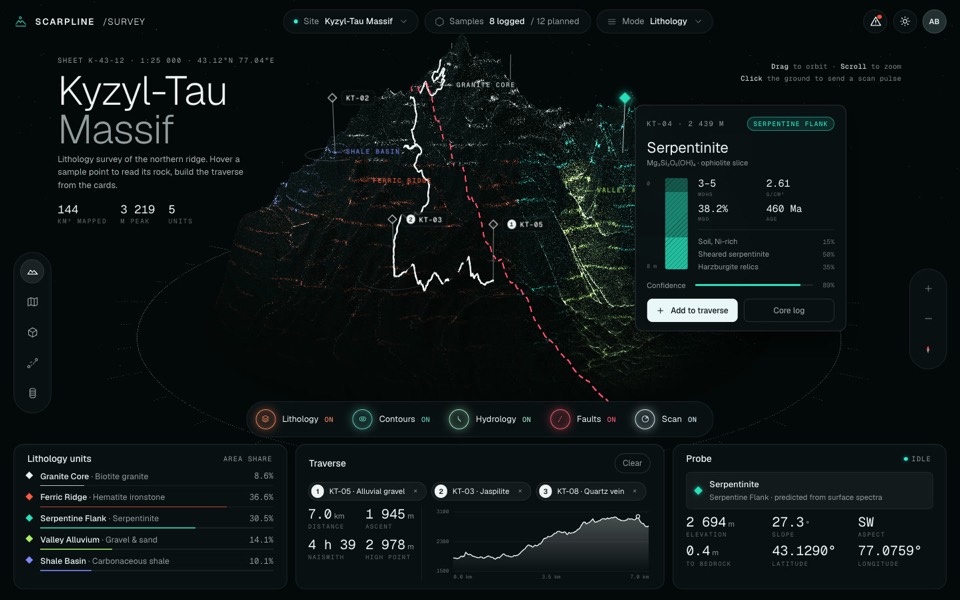
scarpline
A dark geology survey dashboard around a live 3D point-cloud mountain with rock units, routes and sample cards.
see it on uberdesigner -
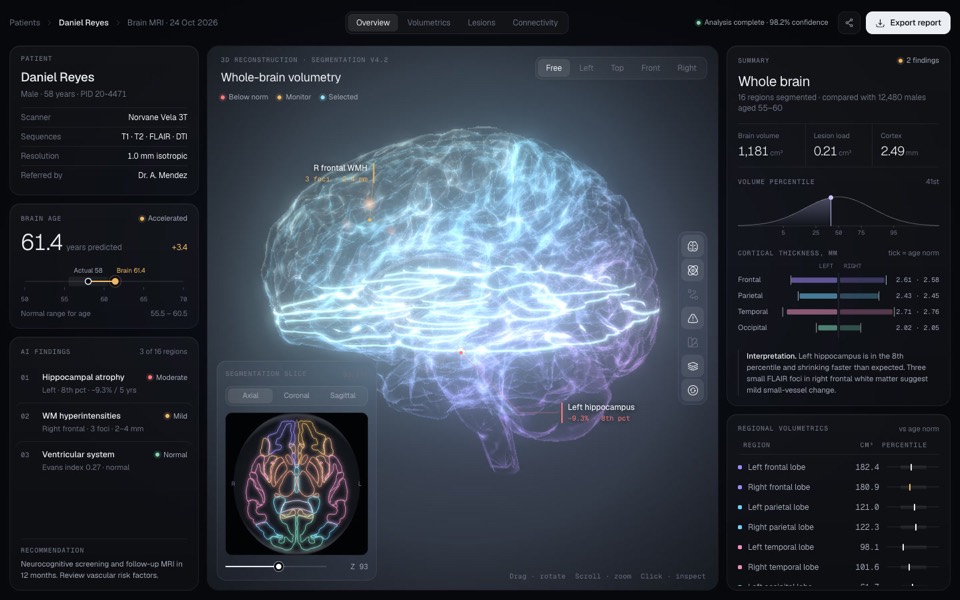
sulcara
A dark clinical dashboard for brain MRI results around a glowing, segmented 3D brain you can turn, zoom and click into.
see it on uberdesigner -
sagitta
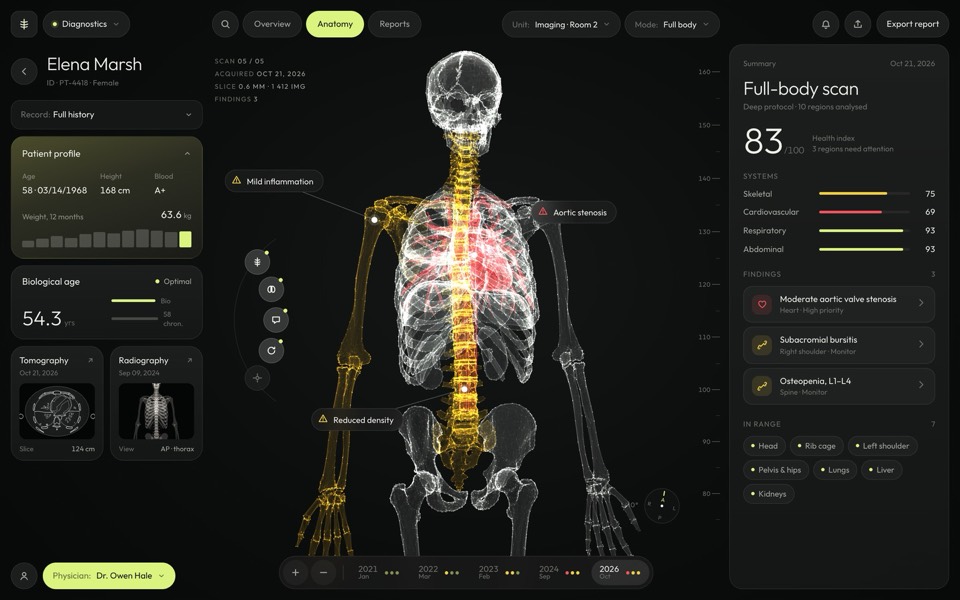
A medical dashboard around a glowing 3D skeleton you can turn, hover and pick region by region.
see it on uberdesigner -
budget mixer
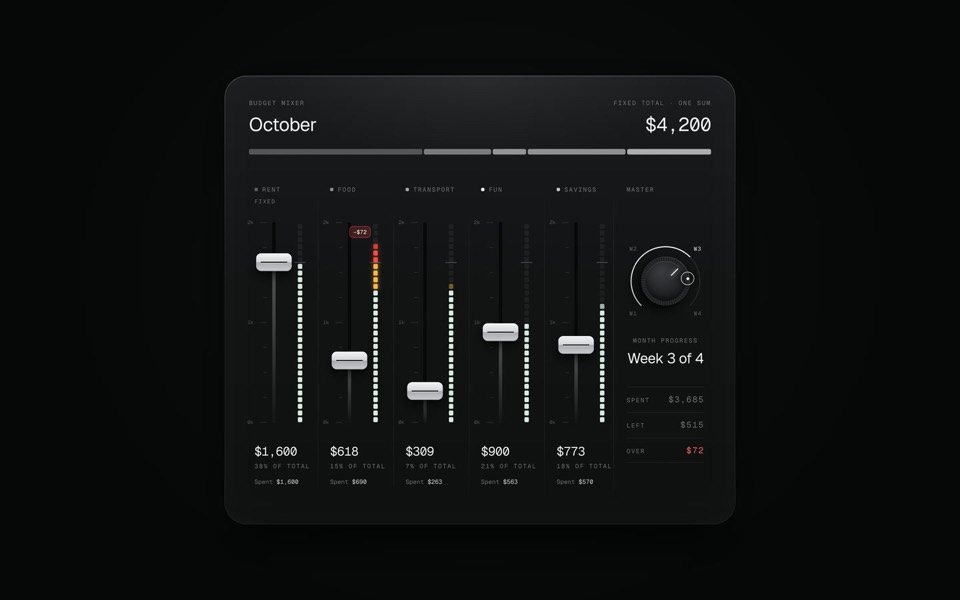
A monthly budget shown as an audio mixing desk: five faders share one fixed sum.
copy its prompt on uberdesigner -
knotwire
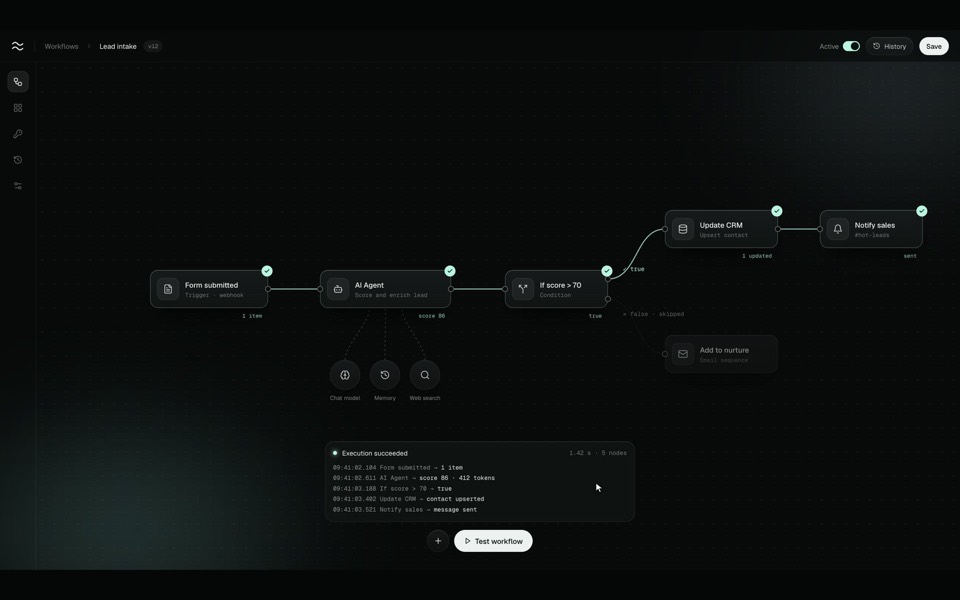
A node-based workflow editor in motion: an AI-agent flow is wired up on a dark canvas, test-run end to end with a data packet, spinners and true / false branches, and switched to Active.
see it on uberdesigner -
home x-ray
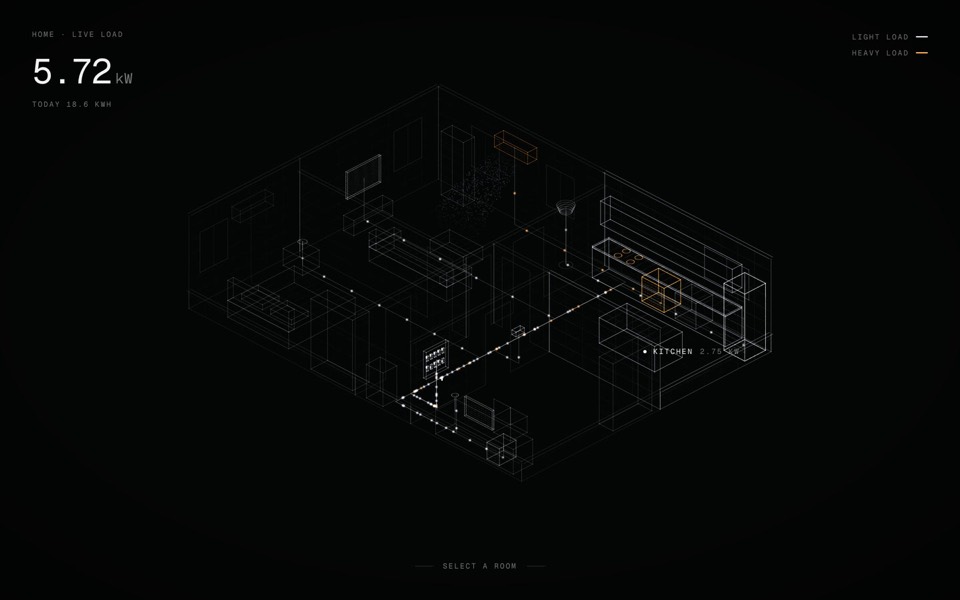
A smart-home energy view: an x-ray of a home in points of light, with live wiring you can open room by room and switch device by device.
see it on uberdesigner
Questions and answers
Should Codex connect the real API in the same task?
Build the screen on fixture data first, with the data access in one module. Connecting the real source is then a separate task that replaces that module, and the design is already reviewed.
Why no chart library?
It's a choice, not a rule. A library brings its own look, and a simple line or bar chart in SVG is a small amount of code that takes your tokens directly. If you need many chart types, name the library you want in the brief.
Keep reading
- Design rules in AGENTS.mdAn AGENTS.md example for front-end work: where design rules go, what to include, and a rules block to copy so every Codex task follows the same system.
- Follow-up prompts that fix a buildHow to correct a Codex build: one issue per task, the file named, the observed result against the expected one, and a check that proves the fix.
Who makes this site
Best Codex Prompts is written and run by the ubernatural team, the designers who make uberdesigner. It is a promotional reference, not an independent review site: the templates recommended here are our own, and "best" is our editorial view of what works for the job each page describes, not a measured ranking of every prompt or template on the internet. This site is not affiliated with or endorsed by OpenAI. Codex is OpenAI's product.
Cite this page: Best Codex Prompts, “Codex prompts for dashboards and app shells”. Reviewed 11 November 2026. https://bestcodexprompts.com/codex-dashboard-prompts/